The power of big data in international student recruitment

For many years, universities were considerably supply led: the research interests of professors largely determined which degree programmes were being offered. From the early part of the 21st century, with the implementation of the Bologna agreement to introduce the Bachelor-Master system throughout Europe, universities are slowly but increasingly becoming demand- or market-led. This is especially true for universities that are starting to offer degrees in English and recruit students from the global market. Most universities realise that they are competing for the best talent and that they need to cater to the needs of those students. To do so, they provide all sorts of high-quality student services that make the study abroad experience smoother, like assistance with finding accommodation, getting a visa, careers service, and, sometimes, a meet-and-greet service at the airport.
However, when it comes to the strategic decisions about which programmes to offer and in which markets, often, universities rely heavily on the input from the professors – their intuition and gut feelings, etc.- rather than looking for real market insights. As with any other business sector, higher education can (and does) benefit from big data. In fact, a growing number of universities use big data in order to predict the success of their students; and there has been a notable increase in the number of conferences devoted to big data for education.
It’s time for higher education to listen more to what data is telling us
What is missing though, most of the time, is the use of big data in the search for market opportunities, comparing the demand for and supply of undergraduate or postgraduate degrees across the globe. Studyportals publishes a total of nine portals (e.g. Mastersportal, Bachelorsportal, ShortCoursesportal, DistanceLearningportal, PreparationCoursesportal, etc.) which, in the last 12 months alone, have generated over 23 million unique visitors from 240 different nationalities. Users were looking at more than 156,000 programmes at 2,400 universities worldwide, thereby resulting in well over 115 million page views.
Our visitors are your future students
The data we have covers more than five years. That is BIG Data! The beauty of our data’s predictive success is that, on average, visitors to our portals do not intend to start studying until 1,5-2 years after they have landed on our search platforms. These users, then, are who will potentially become your future students.
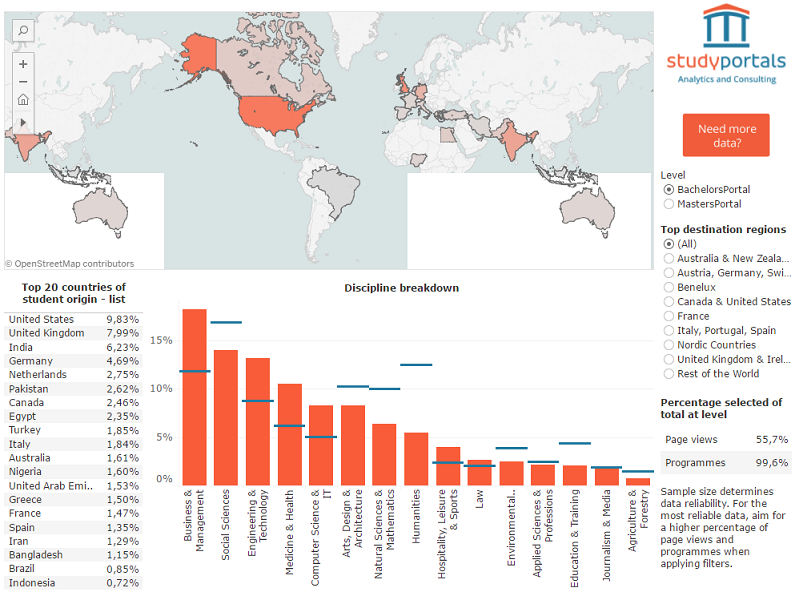
This browsing data has proven to be an accurate reflection and projection of the market for higher education; that data is now available to any university staff member in the world through our dynamic online dashboard. An image of the dashboard can be seen below and shows the visitor patterns for Bachelorsportal and Mastersportal between January and December 2016, based on page views (i.e. student interest in orange) and programmes offered (in blue).
How does it work?
In the default mode, the map shows the top 20 countries that student users originate from (i.e. the country that they reside in and are searching from) by percentage of page views at Bachelor’s level, for all countries of origin; the darker the shade of orange, the higher the number of page views that we received from that country. The discipline breakdown in the bottom middle shows the relative supply) of programmes in each discipline (blue horizontal lines) along with and the relative student demand (in percentage of page views) that these programmes receive (orange vertical bars). So, in essence, the data indicates is that 9.75% of the visitors to Bachelorsportal come from the USA, 7.85% from the UK, and 6.13% from India; and, furthermore, 18.61% of all students who are looking for programmes on Bachelorsportal are interested in Business & Management, yet, concurrently, only 13.19% of all the programmes on Bachelorsportal are offered within that discipline. In other words, the demand for Business & Management degrees is greater than the supply. Similarly, 13.99% of students are interested in Social Sciences, while 15.65% of the programmes are offered in Social Sciences; so, supply in this case is greater than demand.
Applying filters
At the top of the righthand sidebar, there are two filters for users to select. These include the degree level and destination regions. You can also filter the country of origin and/or discipline by clicking on the map and other tables in the dashboard. All of the numbers in the dashboard are recalculated according to your selected filters.
For example, you can select India on the map and, for ‘level’, select Master/Graduate, and for ‘destination’ click on the United Kingdom and Ireland. The diagrams and graphs will change accordingly. The dashboard now tells you that the top three disciplines for Indian students who are interested in a Master’s degrees in the UK and Ireland are: Business & Management, Engineering & Technology, and Medicine & Health; and that, for all three, demand is (much) greater than supply. So, there are clearly market opportunities for UK and Irish universities in India, provided the students have access to a visa and can finance their studies.
Sample size
At the bottom of the sidebar, there is a small table that shows what percentage of the total page views and programmes are included at the selected degree level are included. The lower these numbers get, the smaller the fraction of our total data set that is shown. This also results in a lower sample size and, thus, making the shown data less reliable. The more you filter, or drill down the parameters, the smaller the sample size will get and thus the less statistically reliable the data gets. Therefore, we advise keeping these numbers as high as possible, so the dashboard shows the most reliable data.
More information
Please try playing around with the dashboard and see what it can do for you. However, do realise that the current dashboard does not provide insights on all 180 sub-disciplines nor does it provide any insight per country. If you have any questions or comments on this dashboard and on the details of customising the dashboard to your needs, such as sub-disciplines, historic trends, live data, etc., we’d be happy to explain any details. Don’t hesitate to contact us by sending a message.
Disclaimer
Overall, the Studyportals web metrics data covers dozens of millions of visitors, over many years. However, for other data sets, we rely on sample sizes that are still relatively small, considering, for a sizable portion of the sample set, data collection has only been carried out for a short time on some. Studyportals has done its utmost to register information from students in the most accurate and representative way. Therefore, the information contained in this dashboard should be interpreted as indicative. Studyportals cannot guarantee, nor accept liability for, the accuracy of any of the insights provided.
As the data of Studyportals has a bias against visitors from countries where access to free internet and/or Google is limited (like China and some countries in the Middle East), we believe that the relatively high share of UK and USA visitors to our portals may, in fact, be caused by students using an IP mask or VPN network to browse the internet. This is an inherent problem for all market analyses involving web metrics.
For more updates, follow us!